The signal lies in the distinction between three concepts that the current debate conflates: Technological Life, Economic Life, and Accounting Life.
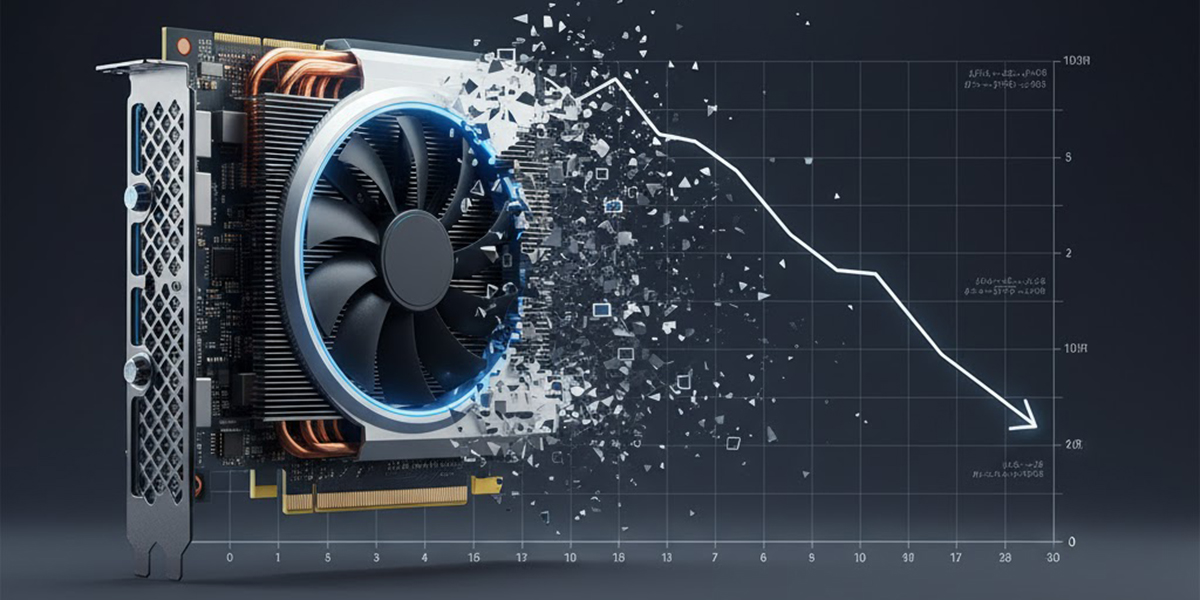
Technological Life (Frontier Utility) is undeniably short and accelerating. Nvidia's shift to an annual product cadence—Hopper (2022), Blackwell (2024), Rubin (2026), Rubin Ultra (2027)—creates genuine 2-3 year frontier obsolescence. The performance improvements are staggering: Blackwell offers up to 25x better energy efficiency than Hopper for specific AI inference workloads. In data centers where power represents the dominant operational cost, this total cost of ownership (TCO) differential renders older hardware non-competitive for frontier model training within 18-36 months. Meta's Llama 3 405B training study (16,384 H100 GPUs over 54 days) documented 148 GPU failures out of 419 total disruptions, implying an annualized failure rate of approximately 9% when extrapolated from the training period—highlighting the physical stress incompatible with extended useful lives for high-utilization training clusters.
Economic Life (Overall Utility) extends further due to the "computing cascade." Hyperscalers redeploy GPUs from Tier 1 Training (Years 0-2) to Tier 2 Inference (Years 2-6+). Inference is less demanding and projected to consume 80% of AI compute cycles by 2030. Market evidence validates this: CoreWeave reported its 5-year-old A100s remain "fully booked" at rental rates that, while down 70% from 2024 peaks, remain decisively non-zero. Google's VP of AI infrastructure stated that 7-8 year old TPUs maintain "100% utilization"—though Google's custom ASICs differ fundamentally from commodity Nvidia GPUs. Azure's retirement data shows K80-class fleets lasted 9 years in production (2014-2023), and P100s served 7 years (2016-2023). This supports an Economic Life of 5-7 years when cascades are managed effectively.
Accounting Life represents management's estimate of the period assets contribute to cash flows. Under GAAP ASC 360 and IFRS IAS 16, companies have significant discretion in setting useful lives, with annual reassessment permitted as a "change in accounting estimate." The critical analytical error in mainstream debate is treating depreciation as a simple calculation (Cost / Useful Life). GAAP requires (Cost - Salvage Value) / Useful Life. The interaction between the Estimated Useful Life (EUL) assumption and the assumed Salvage Value is where the true economics—and the potential for earnings management—reside.
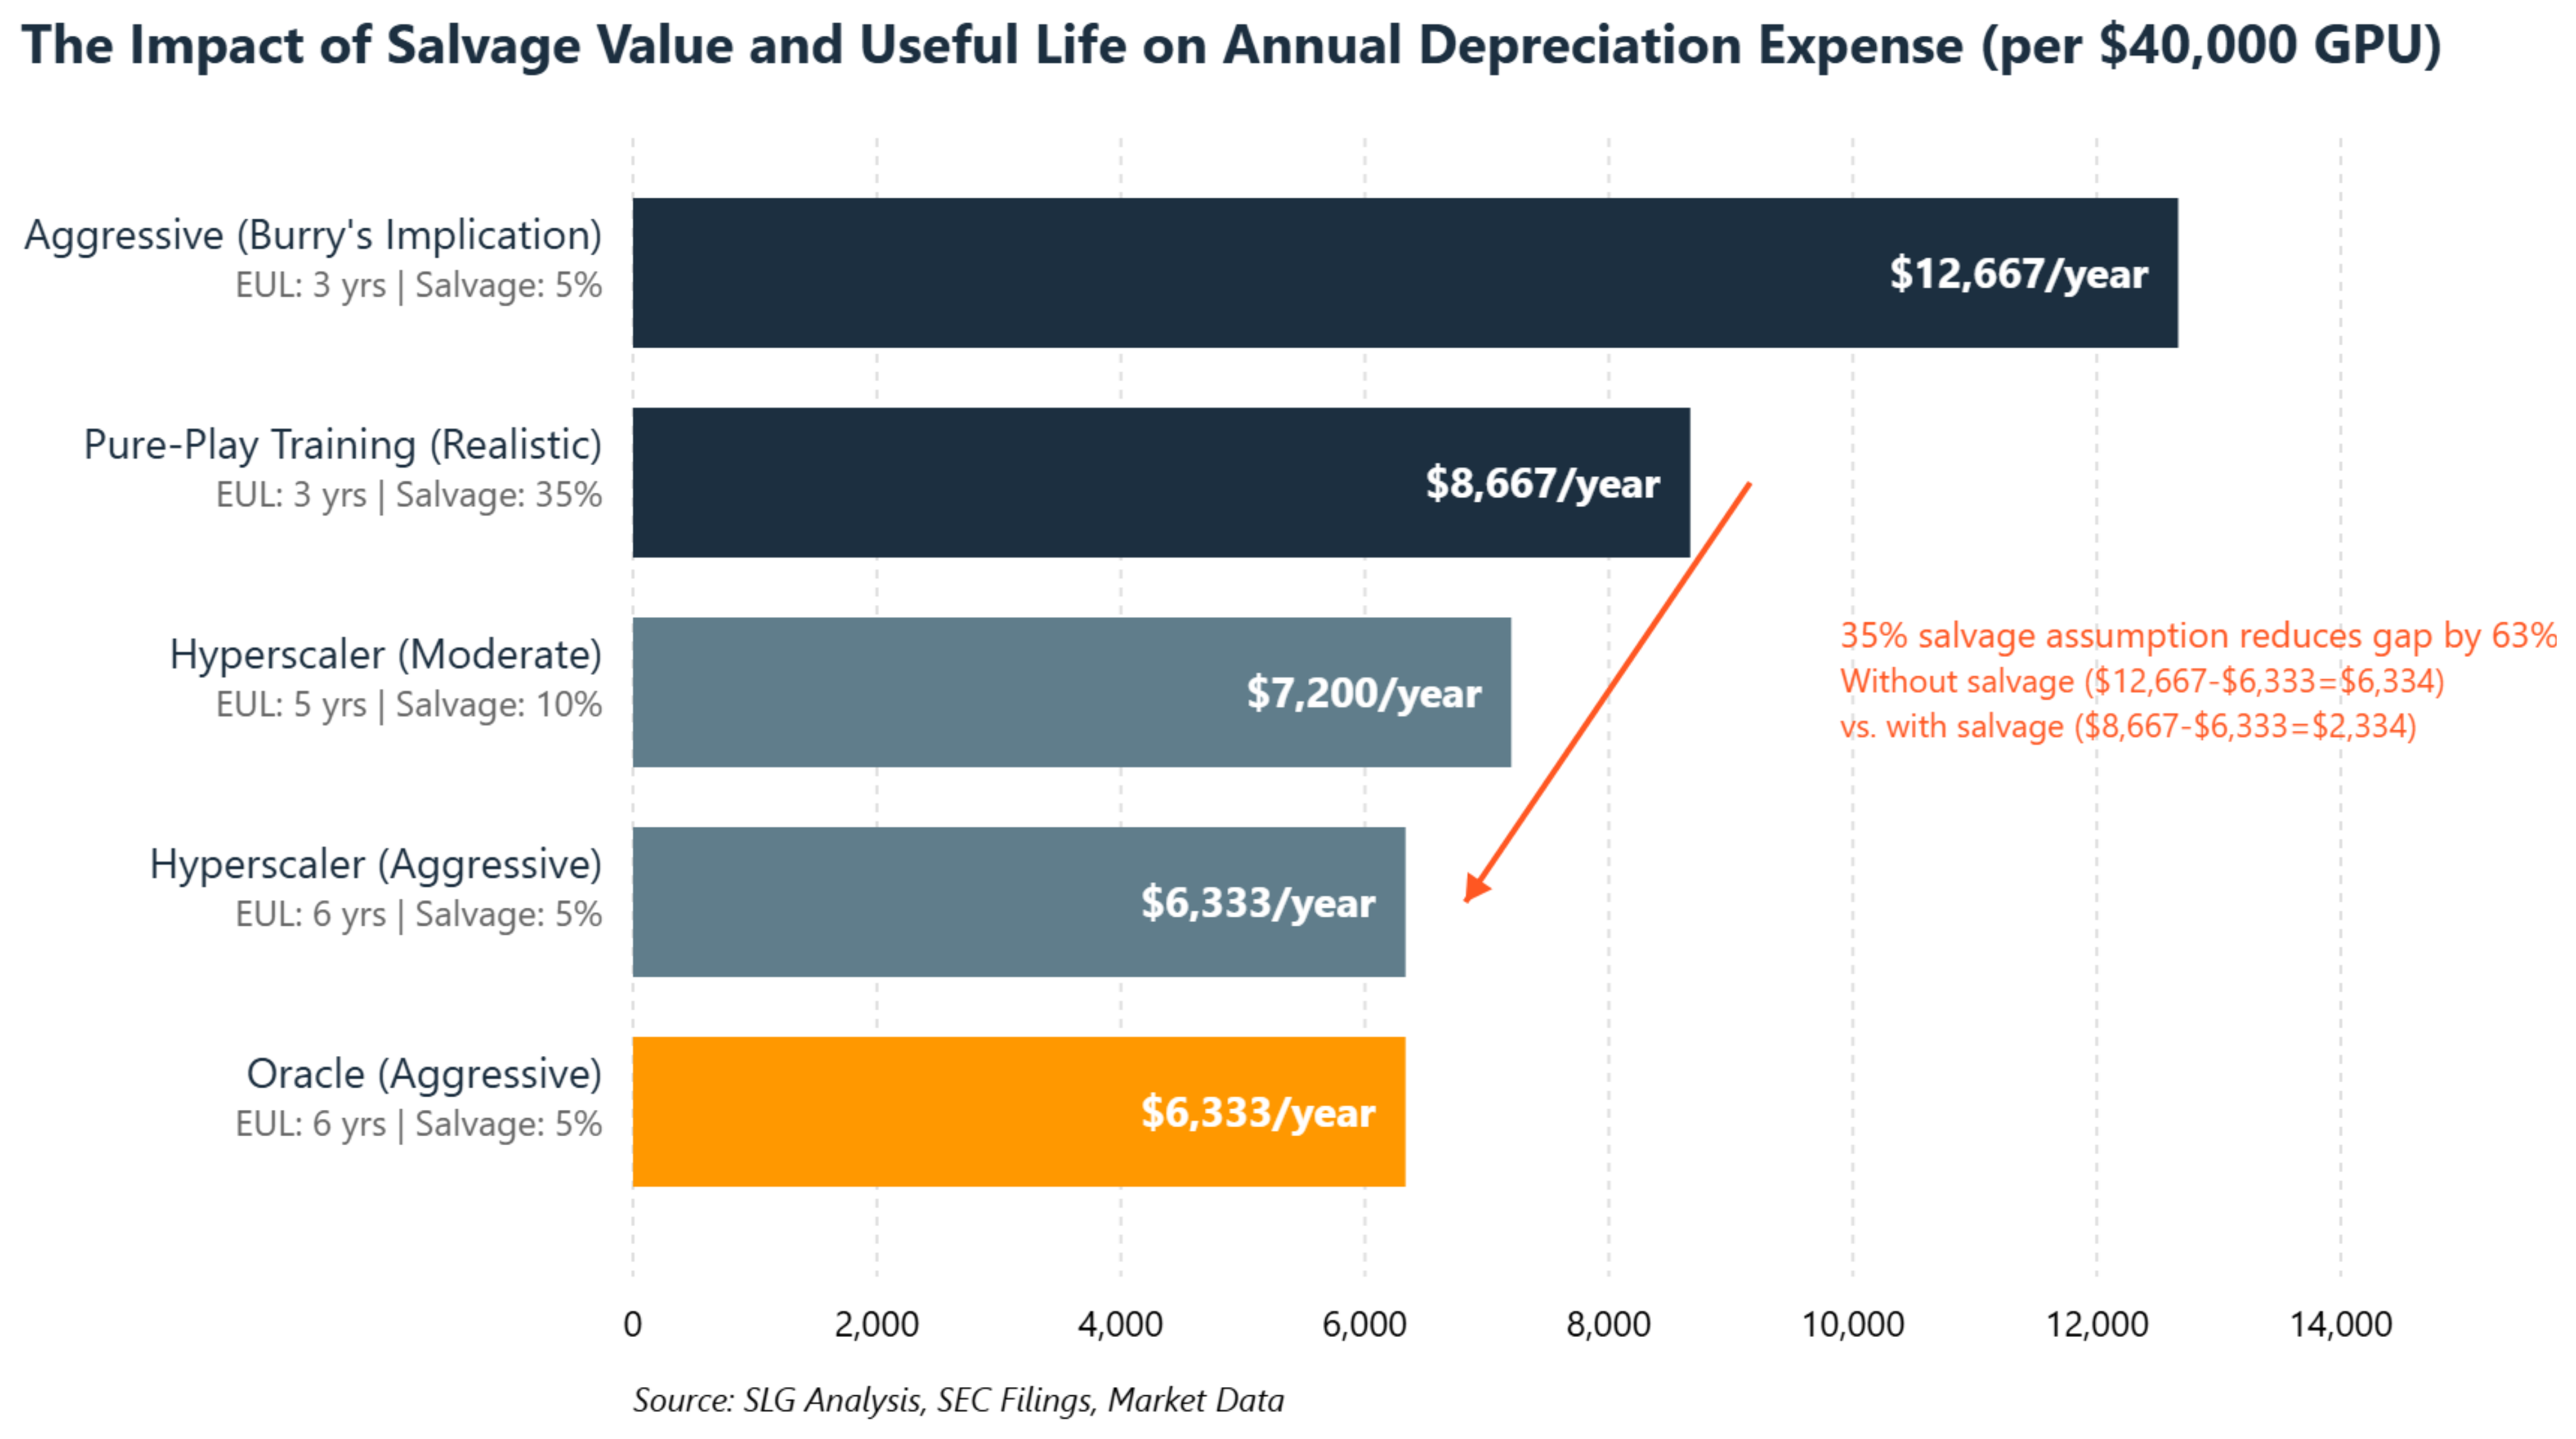
This is why the estimate matters. With capex in the tens (sometimes hundreds) of billions, extending a server life from 4→6 years shifts billions of P&L, even before impairment testing. The question isn't "2-3 vs. 6," it's workload mix and salvage/resale economics versus internal redeployment assumptions.
On evidence weights—the analytical framework matters:
→6, Google 4→6, Meta 4→4.5→5.0→5.5, Oracle 4→5→6) and Amazon's February 2025 reversal (6→5, announced in Q4 2024 earnings call, effective January 1, 2025) are hard facts from SEC filings and deserve the most weight. These are disclosed, audited decisions with quantified dollar impacts.
The Great Hyperscaler Divergence—Amazon's February 2025 Reversal:
In the same quarter, Amazon shortened the useful life for a subset of its servers and networking equipment from 6 years back to 5 years (announced February 2025, effective January 1, 2025), explicitly citing the "increased pace of technology development, particularly in the area of artificial intelligence and machine learning." Amazon took a $700 million operating income hit. They also early-retired a subset of equipment, taking a $920 million accelerated depreciation charge in Q4 2024.
Simultaneously, Meta extended to 5.5 years, booking a $2.9 billion reduction in depreciation expense. Oracle maintains a 6-year schedule for servers and network equipment.
This divergence—occurring under identical technological conditions—confirms that useful life is a subjective management estimate reflecting corporate strategy and accounting conservatism, or the aggressive lack thereof. The $3.6 billion earnings quality gap between Amazon's conservative reversal and Meta's optimistic extension is the story, not the absolute depreciation numbers.
The public discourse has devolved into a noisy, binary debate: either hyperscalers are committing massive fraud (Burry's framing), or their 6-year depreciation schedules are perfectly justified by the computing cascade (the industry defense). Both extremes are oversimplifications that obscure the nuanced reality.
The "Fraud" Narrative is Noise:
The allegation of "fraud" is hyperbolic and legally unsubstantiated. GAAP (ASC 360) and IFRS (IAS 16) grant management significant discretion in setting useful lives. Fraud requires intentional deception with intent to mislead; these changes are disclosed in SEC filings with specific dollar impacts and supported by a rational, albeit optimistic, economic argument (the cascade model). Changes in accounting estimates are explicitly permitted under GAAP as long as they reflect management's best judgment of economic reality.
Furthermore, the "fraud" narrative incorrectly groups all hyperscalers. Google's 6-year schedule is highly defensible because its AI workloads run primarily on custom ASICs (TPUs) that Google controls end-to-end. Google engineers the entire stack (hardware, firmware, software optimization) and is not subject to the external Nvidia "death clock." Their internal data showing 7-8 year old TPUs at 100% utilization genuinely supports longer lifespans for these specialized, vertically-integrated assets. The Great Divergence (Amazon shortening while Meta extends) further proves this is not a coordinated conspiracy—it's management discretion applied to heterogeneous asset portfolios.
The Uncritical "Cascade Defense" is Also Noise:
Conversely, the industry defense—that the cascade universally justifies 6-year schedules—is dangerously misleading. It relies on historical data derived from slower CPU upgrade cycles that are irrelevant to the current pace of GPU innovation. A 2017 Hopper GPU operating in 2025 at reduced utilization for batch inference is fundamentally different from a 2025 Blackwell B200 purchased for frontier LLM training. More critically, this defense ignores three imminent threats to the cascade model:
First, saturation risk. The sheer volume of GPU purchases creates arithmetic saturation risk. At $300B+ annual spend and $35K average per GPU, hyperscalers are purchasing approximately 8.6 million GPUs annually (2024-2025). If each GPU serves 3 years in training before cascading to inference, and inference demand grows from 20% to 80% of workload mix by 2030, the math implies:
This creates binary outcome risk: Either inference scales as projected (validating 6-year schedules) or saturates (forcing write-downs). If inference demand doesn't scale 16x as projected (from 20% to 80% of AI compute), secondary markets will collapse, salvage value assumptions will prove optimistic, and hyperscalers will face forced write-downs.
Second, specialization risk. Hyperscalers are aggressively deploying custom, highly efficient ASICs specifically for inference (AWS Inferentia/Trainium, Microsoft Maia, Meta MTIA). These specialized chips often offer superior TCO for inference than older-generation, power-hungry training GPUs. If a specialized $10K inference ASIC outperforms a 3-year-old $35K H100 on inference workloads, the H100 becomes obsolete for both training and inference, collapsing the cascade model entirely.
Third, Meta's successive extension pattern. Meta has extended useful lives three times in three years:
Each extension occurred precisely as AI capex accelerated, with the January 2025 extension booking a $2.9 billion depreciation reduction in the same quarter Amazon shortened its schedule and took a $700 million hit. This "earnings management ladder" is more concerning than a single extension—it shows a pattern of adjustments to smooth earnings as capex-to-revenue ratios approach 36% (highest among hyperscalers). Combined with projected free cash flow collapse to $20B in 2025 (down from $54B in 2024), Meta represents the clearest earnings quality red flag.
The noise is the assumption that current accounting practices are sustainable indefinitely without reconciliation to technological and economic reality.
The tension between 2-3 year technological obsolescence and 5-7 year economic utility defines the current AI infrastructure landscape. The systematic extension of accounting useful lives during an unprecedented CapEx boom (2022-2024) is aggressive earnings management. While not fraudulent, the practices at Meta and Oracle represent significant deterioration in earnings quality.
The solution: component-based depreciation. This involves segmenting the rapidly obsolescing GPU modules (3.5-4.5 year useful life, realistic 30-35% salvage value) from the longer-lived infrastructure such as chassis, networking fabric, power distribution, and cooling systems (6-8 year useful life). Current monolithic blended rates fail to capture the rapid economic consumption of the frontier training fleet while overstating depreciation on reusable infrastructure. This is not theoretical—GAAP ASC 360 explicitly permits and encourages component depreciation when components have materially different useful lives.
Investment implications hinge on this distinction. Investors must look beyond GAAP Net Income and focus on the divergence between reported earnings and Free Cash Flow (FCF). Meta's FCF is projected to decline to ~$20B in 2025 from $54B in 2024 despite strong reported earnings, revealing the cash reality behind accounting choices.
Company-specific assessment:
What to watch next (Q1-Q2 2026):
(1) Depreciation policy disclosures in 10-K filings (March-April 2026)—watch for Microsoft/Google cohort-specific schedules; red flag if Meta extends beyond 5.5 years;
(2) H100/Blackwell secondary market pricing—current H100 rental at $2.85-$3.50/hour (down 70% from $8-10 peak); cascade saturation signal if H100 drops below $2.00/hour;
(3) Utilization disclosure in MD&A—Google's 7-8 year TPU claim should be validated with GPU vintage breakdown; test case: Do Q4 2025/Q1 2026 disclosures show utilization by cohort?;
(4) CFO commentary on AI infrastructure ROI—Amazon set precedent with explicit AI-driven reversal; watch for similar language from Microsoft/Google.
The test for 2026 isn't whether "2-3 or 6" wins—it's whether managements align policy with observed cascades and give investors data to adjudicate.
If the pace of innovation continues or the computing cascade saturates due to specialization or sheer volume, hyperscalers will be forced to shorten useful lives or recognize impairment charges. The AI boom is real, but its reported profitability is currently enhanced by accounting optimism. Follow Amazon's lead: focus on the cash flow statements and the footnotes—the true economics are revealed there, not in the P&L.
The materiality of this signal is exceptionally high, representing a potential $176 billion earnings adjustment through 2028 and fundamentally altering P/E valuation metrics of the largest companies driving the market. The "Great Hyperscaler Divergence" (Amazon shortening vs. Meta extending in early 2025) confirms that useful life is being used as an active lever for earnings management under identical technological conditions. While non-cash in the short term, the reliance on the computing cascade introduces significant risk: if saturation or specialization disrupts the model (early warning signs visible in 70% H100 rental price declines), forced accounting adjustments will trigger substantial P&L hits and market disruption. This signal directly impacts the perceived financial health and earnings quality of the entire AI ecosystem. Amazon's reversal provides the clearest investment signal—follow companies that adjust depreciation to reality, not to analyst expectations.
This commentary is provided for informational purposes only and does not constitute investment advice, an offer to sell, or a solicitation to buy any security. The information presented represents the opinions of The Stanley Laman Group as of the date of publication and is subject to change without notice.
The securities, strategies, and investment themes discussed may not be suitable for all investors. Investors should conduct their own research and due diligence and should seek the advice of a qualified investment advisor before making any investment decisions. The Stanley Laman Group and its affiliates may hold positions in securities mentioned in this commentary.
Past performance is not indicative of future results. All investments involve risk, including the potential loss of principal. Forward-looking statements, projections, and hypothetical scenarios are inherently uncertain and actual results may differ materially from expectations.
The information contained herein is believed to be accurate but is not guaranteed. Sources are cited where appropriate, but The Stanley Laman Group makes no representation as to the accuracy or completeness of third-party information.
This material may not be reproduced or distributed without the express written consent of The Stanley Laman Group.
© 2025 The Stanley-Laman Group, Ltd. All rights reserved.
SLG is an independent investment management and advisory firm serving ultra-high-net-worth individuals, families, and institutions.