
The enterprise AI story everyone should be watching isn't the one making headlines. It's the $4 billion coding tools category—up from $550 million just twelve months ago. That's 7.3x growth in a single year, representing 55% of all departmental AI spending.
The numbers from Menlo Ventures' 2025 State of Generative AI report tell a story the bubble skeptics can't explain away:
Coding AI Market Metrics (2024 → 2025):
Two products now exceed $1 billion in annual recurring revenue in this category—Cursor and GitHub Copilot—with Anthropic's Claude Code approaching that threshold at $500 million+ run-rate. A year ago, none existed at that scale.
What makes coding the "killer app" isn't just the spending trajectory—it's the measurement clarity. When a developer completes 26% more tasks per day (the finding from MIT and Harvard's randomized controlled trial across 4,867 developers), that's not a survey response or executive optimism. It's observable output. When Nvidia's 40,000 engineers adopt a tool, when OpenAI's own developers use a competitor's product, the signal is unmistakable.
"Cursor achieved something unprecedented: $1 million to $1 billion ARR in under two years—with no outbound sales team and no product managers."
The growth mechanics reveal why this category broke through first. Cursor's trajectory—$1M (December 2023) → $100M (January 2025) → $500M (May 2025) → $1B (November 2025)—represents the fastest B2B SaaS scale in recorded history. Enterprise revenue grew 100x year-to-date. Over 50% of Fortune 500 companies now have Cursor deployments.
This happened through pure product-led growth. Developers adopted the tool because it delivered immediate, measurable productivity gains. No procurement cycles. No pilot programs. No executive mandates. The 47% deal conversion rate Menlo reports for AI tools (versus 25% for traditional SaaS) isn't driven by hype—it's driven by users who can quantify their own velocity improvements within hours of adoption.
The Anthropic Surge
Behind the coding explosion sits a market share reversal that most coverage has missed entirely. Anthropic's Claude models now command 54% of the enterprise coding market (measured by estimated API spending in production workloads)—more than double OpenAI's 21%. In broader enterprise LLM usage, Anthropic holds 40% share, up from just 12% in 2023, while OpenAI declined from 50% to 27% over the same period.
Enterprise LLM Market Share (2023 → 2025):
The concentration is striking: 88% of enterprise LLM API spending flows to just three providers. But the hierarchy inverted. While media attention remained fixed on ChatGPT's 800 million weekly users, enterprises quietly shifted production workloads to Claude.
Claude Code—Anthropic's dedicated coding agent—crossed $500 million in annualized revenue by September 2025. That single product line, launched just eight months ago, now rivals entire SaaS companies in scale.
Healthcare: The Second Vertical Breaks Through
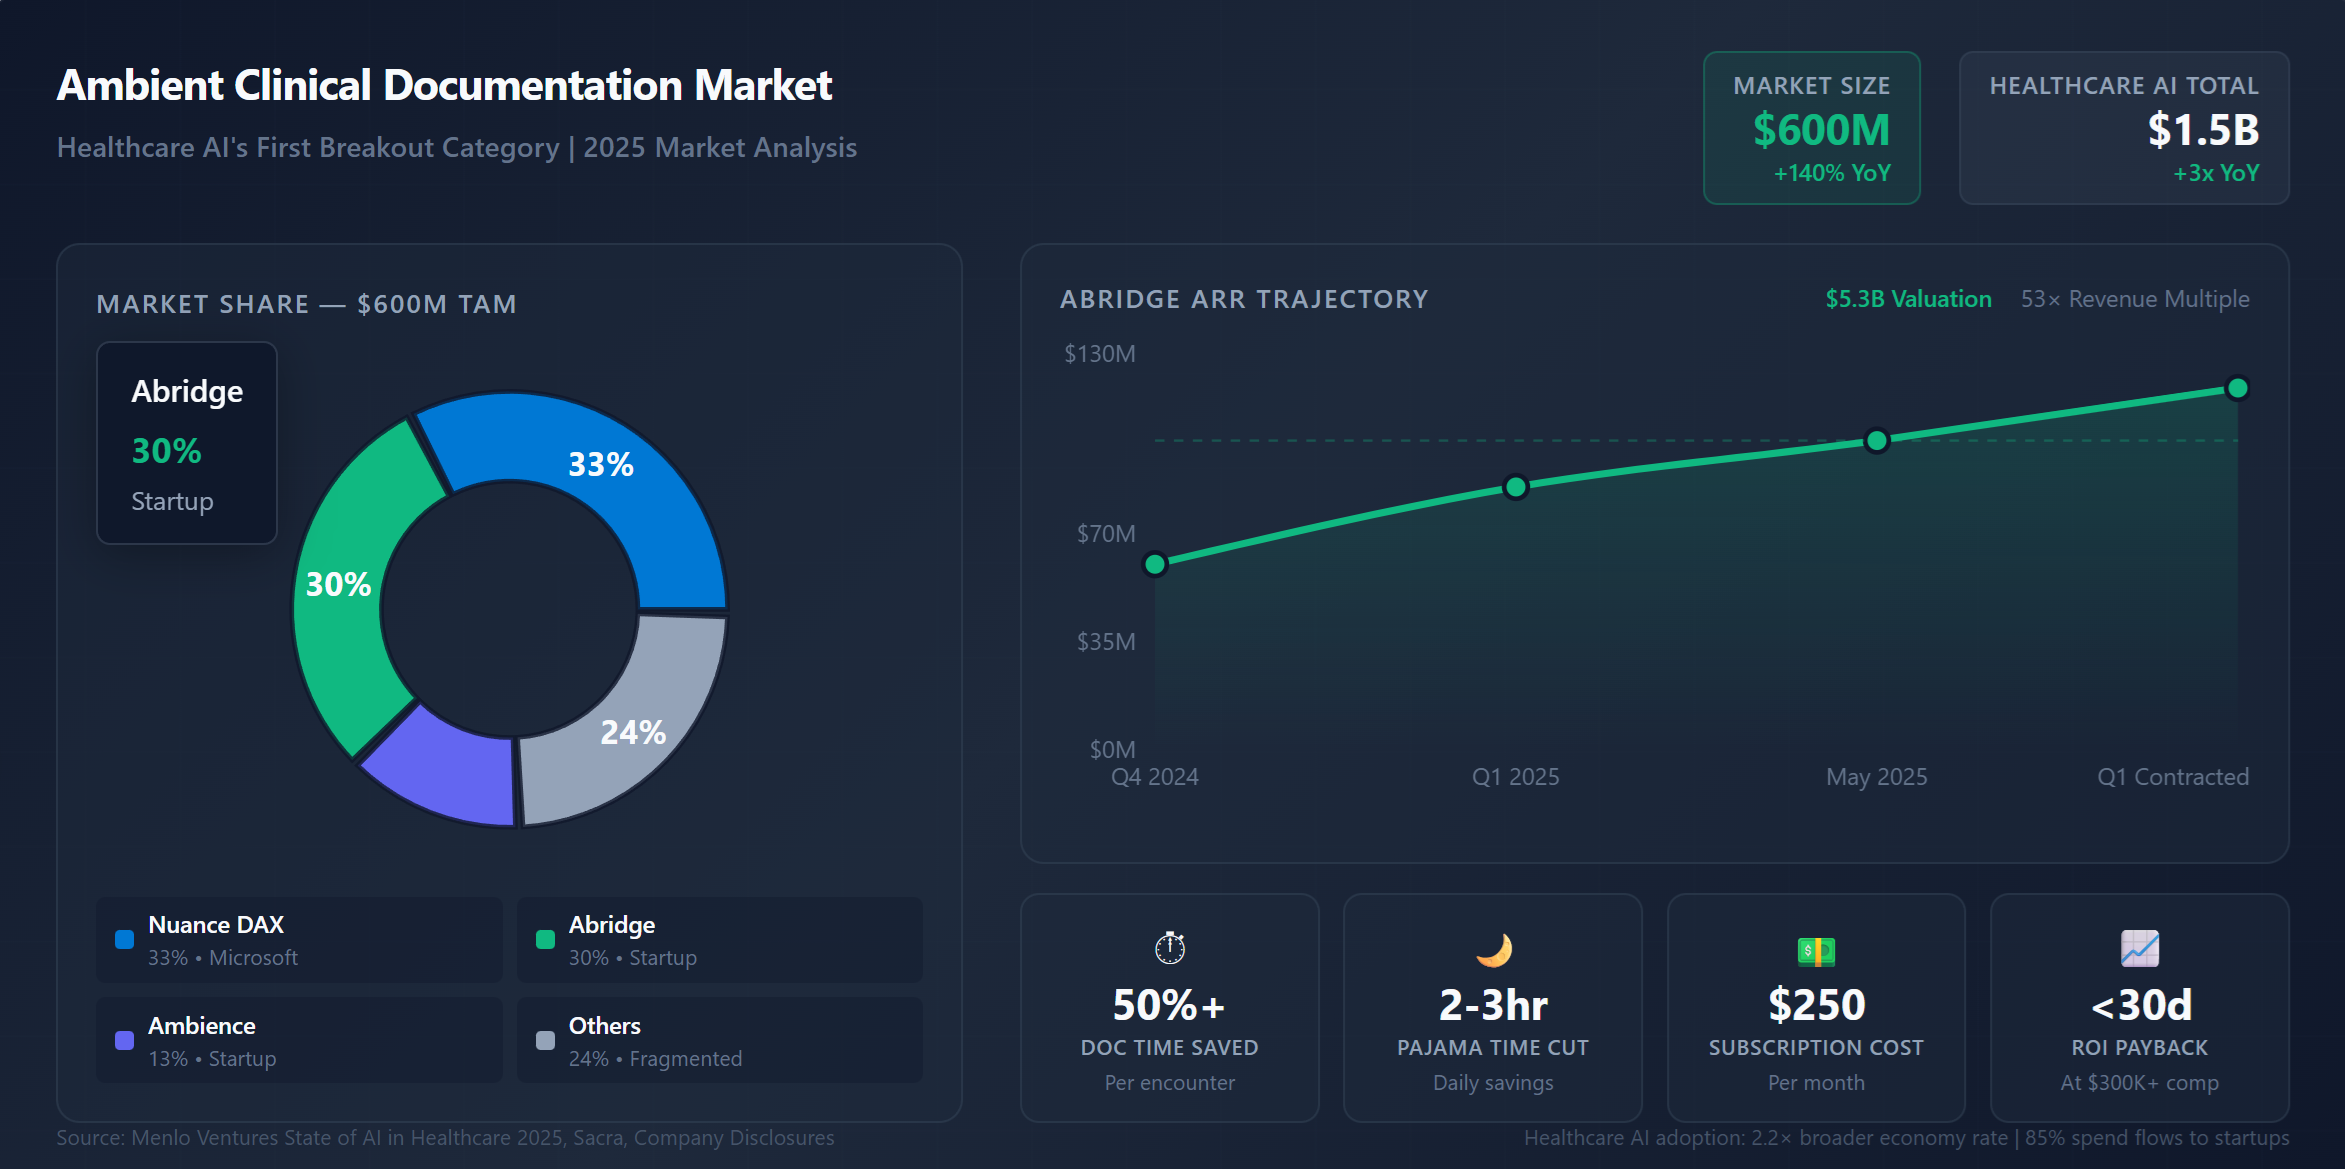
The coding category's success isn't an anomaly—it's a template now replicating in a second massive vertical. Healthcare AI reached $1.5 billion in enterprise spend—3x year-over-year growth—with ambient documentation scribes accounting for $600 million of that total.
The category leader dynamics mirror coding: startups dominating, measurable outcomes driving adoption, and productivity gains too obvious to ignore.
Ambient Scribe Market Share:
Abridge's trajectory illustrates the pattern. From $60 million ARR at year-end 2024 to $100 million+ by mid-2025, the company now serves 150 health systems processing 50 million medical conversations annually. Kaiser Permanente's deployment represents the largest healthcare AI rollout ever executed.
The ROI math is brutally simple: physicians spend 2-3 hours per day on documentation—the infamous "pajama time" of charting after hours. Ambient scribes cut that by 50% or more. With physician compensation exceeding $300,000 annually and documentation consuming 15-20% of their workday, a $250/month AI subscription pays for itself within weeks. Healthcare is adopting AI at 2.2x the rate of the broader economy because the value proposition is undeniable.
What the Productivity Data Actually Shows
The evidence for coding productivity gains is remarkably consistent when measured correctly. The MIT/Harvard randomized controlled trial—4,867 developers across three companies—found 26% more tasks completed with AI assistance, with gains concentrated among newer developers. Menlo's survey data shows teams reporting 15%+ velocity improvements.
The METR study—16 experienced developers in their own familiar codebases—found AI added 19% overhead. This measures precisely the scenario where AI should underperform: experts navigating territory they already know. The MIT study measured what matters commercially: broader populations tackling new code generation.
The labor market offers suggestive evidence that the effect is real. Stanford data shows developers aged 22-25 lost nearly 20% of jobs since late 2022—precisely coinciding with ChatGPT's emergence. Developers 26 and older saw stable or growing employment. While the broader tech hiring slowdown contributes to this pattern, companies appear reluctant to hire junior developers for work that senior developers with AI tools can now accomplish. That's productivity measurement expressed through hiring decisions.
The most persistent skeptic narrative cites a massive infrastructure-to-revenue disconnect: hyperscalers are spending $400 billion+ on AI infrastructure while actual AI software revenue sits around $100 billion. Goldman Sachs analysts warn of a "revenue gap." Headlines declare that returns aren't materializing. Some predict an imminent bust.
The framing is correct. The conclusion is wrong.
The skeptics are measuring infrastructure economics and expecting them to explain application economics. These are different layers with different timelines, different capital structures, and different return profiles.
"When critics cite '95% of AI pilots fail,' they're measuring experimental internal builds. The same MIT study found vendor-purchased solutions succeed 67% of the time."
The Categorical Error Explained
The oft-cited MIT "GenAI Divide" study—claiming 95% of enterprise AI initiatives deliver zero measurable ROI—requires careful reading. The study examined "pilot programs" and "experimental initiatives." The 95% failure rate applies specifically to custom internal builds: companies trying to develop their own AI solutions from scratch.
The same research found a completely different pattern for purchased solutions:
AI Deployment Success Rates by Type:
When enterprises buy from specialized vendors—Cursor for coding, Abridge for clinical documentation, Intercom for customer support—they succeed two-thirds of the time. When they try to build internally, they fail 95% of the time.
This distinction explains the apparent paradox of $37 billion in enterprise AI spending coexisting with headlines about rampant failure. The spending is real. The failures are real. But they're measuring different populations.
Microsoft Copilot: The Counter-Example That Proves the Rule
Microsoft's Copilot experience illustrates the distinction perfectly. After two years and the largest enterprise software push in history, conversion reportedly sits around 2%—approximately 8 million active users across 440 million Microsoft 365 subscribers.
Internal reports suggest the product struggles with integration quality. Microsoft has reportedly offered significant discounts to drive adoption. The horizontal "AI everywhere" approach—bolting copilots onto every Microsoft product—isn't delivering the adoption curve that focused tools achieve.
Meanwhile, Cursor—focused exclusively on one use case—hit $1 billion ARR in under two years. The difference isn't the underlying technology; both rely on similar model capabilities. The difference is deployment precision.
Broad, horizontal AI deployment struggles. Focused, vertical deployment succeeds. The "bubble" narrative conflates these approaches, treating all AI spending as equivalent when the outcomes are categorically different.
The Infrastructure Spend Isn't Revenue—It's Capex
The $400 billion in hyperscaler infrastructure investment isn't meant to generate 2025 revenue any more than railroad construction in the 1870s was meant to generate immediate returns. It's capital expenditure building capacity for future demand.
The relevant question isn't whether 2025 infrastructure spend matches 2025 AI revenue. It's whether the application layer—where the $37 billion in enterprise software spending actually flows—is generating returns.
At the application layer, the evidence is unambiguous:
The bubble skeptics are looking at Nvidia's data center bills and concluding that AI doesn't work. That's like examining AWS's server costs and concluding that SaaS is a failure. Infrastructure investment and application returns operate on different timescales.
What the Skeptics Get Right
The bubble narrative isn't entirely wrong—it's just imprecise. Horizontal AI deployment is failing. Enterprise-wide "transformation initiatives" are burning money. Companies trying to build rather than buy are wasting capital.
The 95% failure rate is real for that segment. The $600 billion infrastructure gap is real at that layer. The ROI concerns are valid for that approach.
But the skeptics miss the counter-pattern: focused deployments in high-frequency, measurable workflows are generating immediate returns. The applications are working. The transformation theater is not.
The enterprise AI market hasn't crossed a single chasm—it's crossing multiple chasms at radically different speeds. Coding tools are in late majority adoption. Healthcare AI is reaching early majority. Most horizontal "copilot" deployments remain stuck in early adopter pilot purgatory.
The investment framework that emerges is straightforward: AI ROI follows deployment precision. Success concentrates in categories with three characteristics:
Investment Implications
Overweight — Focused vertical AI (Cursor, Abridge): Proven unit economics, measurable ROI, product-led adoption driving rapid expansion.
Overweight — Anthropic-exposed infrastructure: 40% enterprise share, coding dominance, enterprise-first positioning versus OpenAI's consumer focus.
Underweight — Horizontal "copilot" plays: ~2% conversion rates, integration quality struggles, mandate-driven rather than user-driven adoption.
Avoid — AI "transformation" consulting: 95% pilot failure rate for custom internal builds; capital destruction masquerading as innovation.
The broader hyperscaler capex—NVIDIA, the cloud providers—remains a reasonable infrastructure bet, but the application-layer story is more actionable. Enterprises are consolidating around vendors who deliver measurable productivity gains, not those promising vague transformation.
What to Watch
The categorical confusion will resolve over the next 12-18 months as budget cycles force accountability. CFOs asking "what did we get for that AI spend?" will find clear answers from coding and healthcare deployments, and silence from transformation initiatives.
Net revenue retention for AI SaaS vendors becomes the critical metric. If Cursor's enterprise customers expand (likely given 100x growth), the thesis strengthens. If horizontal copilots show improving conversion (currently no evidence), the skeptic case weakens.
The "boom versus bubble" framing misses the point. Both are happening simultaneously, in adjacent but distinct markets. The signal is in deployment precision. The noise is in the aggregate.
The coding category's $4 billion scale, 7.3x growth trajectory, and multiple billion-dollar products provide the clearest validation yet of enterprise AI generating real economic returns. Healthcare's parallel trajectory at $1.5 billion confirms the pattern extends beyond developer tools. The deduction for imprecision: productivity gains remain task-dependent, and the 15%+ velocity improvements require nuanced interpretation. The Anthropic market share data, while verified across multiple sources, carries inherent measurement complexity given the API-versus-subscription distinction. What earns the high rating is the convergence of spending data, revenue data, and labor market signals all pointing the same direction—this is working in focused deployments, failing in broad ones, exactly as a "deployment precision" thesis would predict.
Disclosure: Menlo Ventures, the source of the enterprise AI market data cited throughout, is an investor in Anthropic. The market share figures have been verified against multiple independent sources including Ramp transaction data (which measures a different metric) and company announcements. The author holds no positions in companies mentioned.
This commentary is provided for informational purposes only and does not constitute investment advice, an offer to sell, or a solicitation to buy any security. The information presented represents the opinions of The Stanley Laman Group as of the date of publication and is subject to change without notice.
The securities, strategies, and investment themes discussed may not be suitable for all investors. Investors should conduct their own research and due diligence and should seek the advice of a qualified investment advisor before making any investment decisions. The Stanley Laman Group and its affiliates may hold positions in securities mentioned in this commentary.
Past performance is not indicative of future results. All investments involve risk, including the potential loss of principal. Forward-looking statements, projections, and hypothetical scenarios are inherently uncertain and actual results may differ materially from expectations.
The information contained herein is believed to be accurate but is not guaranteed. Sources are cited where appropriate, but The Stanley Laman Group makes no representation as to the accuracy or completeness of third-party information.
This material may not be reproduced or distributed without the express written consent of The Stanley Laman Group.
© 2025 The Stanley-Laman Group, Ltd. All rights reserved.
SLG is an independent investment management and advisory firm serving ultra-high-net-worth individuals, families, and institutions.